|
|
|
How to Put Logs On A Map |
|
When
used with a GPS, CQ/X logs
the coordinates of each
QSO
in a file separate from the QSO log. Once the QSO party is over, and
the log submission deadline is past, this
log can be used to create a unique searchable view of the mobile
operation showing
the map location
from which each QSO was made. Creation of a log on a map for
your operations consists of two main steps the first of which is to
build a KML file that will provide the background map display showing
each county activated including color coding by the number of QSOs from
that county and, as a user option, a pushpin for each QSO.
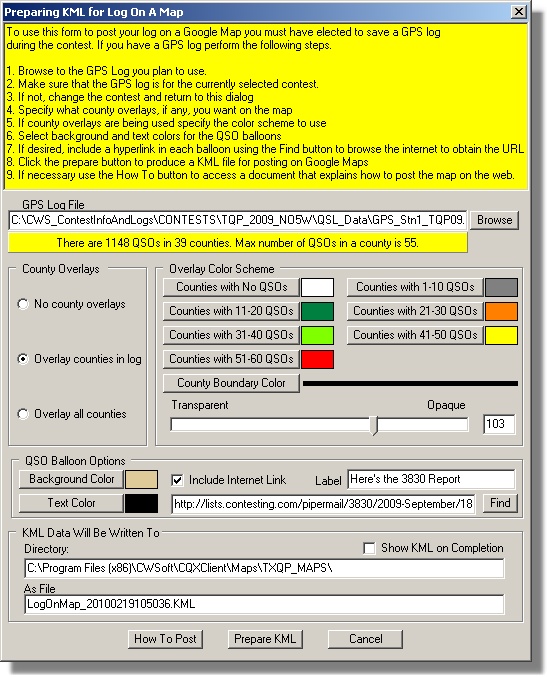 To build
the background KML file you use the QP Tools
menu and select
the Prepare Log On A Map which activates a
dialog
for formating and preparing the KML file that will form the
background map. To build
the background KML file you use the QP Tools
menu and select
the Prepare Log On A Map which activates a
dialog
for formating and preparing the KML file that will form the
background map.First it's necessary to make sure that the log you are going to post is for the contest that you currently have selected. If not you exit this dialog and use the New Contest item under the Files menu to select the contest that corresponds to the GPS log. This will ensure correct county polygon data is loaded into the program. Once the GPS log file is selected it will be analyzed for number of counties, number of QSOs, and maximum QSOs in a county in order to determine the number of color coding selections that are needed. You can elect to include county overlays for all of the counties in the state, or for only those that you have activated, or no county overlays at all. If you choose to show overlays then you may want them to be color coded based on the number of QSOs in each. You select the colors to be used along with the color for the boundary line and the opacity/transparency of the overlay colors. You then select background and text colors for the QSO balloons that will be activated. You decide to include a hyperlink to the 3830 report that you filed earlier. You use the Find button to locate the URL for the report in the 3830 archives and then paste the URL into the edit box immediately to the left of the Find button. Since Log on a Map is a
database-driven dynamic web application that uses AJAX, PHP, and MySQL,
the second major step in publishing it is to populate an on-line
database and to build a PHP script that uses AJAX to dynamically
publish QSO data from the database. All of these technologies are
freely available and the PHP script that implements the Log on a Map is
available as part of CQ/X so the only task required by the user is to
set up and populate the database on his web server. Details describing
this task are included in the Create
Logs on a Map
document
which can be downloaded from the documentation
page.
The screen shot below shows an example wherein the blue pushpins represent all QSOs and the red ones the QSOs of the selected station, in this example DL3DXX. The county coloring and the blue pushpins form the background and are the result of the KML prepared using the above dialog. The red pushpins are the dynamic part that are selected each time the user choses a different call. This link will take you to the live log on a map where you can choose a QSO party operation from some examples from the operations of NO5W/M over the last several years. Choose an operation and then select a call of interest from the available calls to see all of the locations from which the selected station was worked. If you're interested in the scenery at the point of the QSO click on the Street View button. 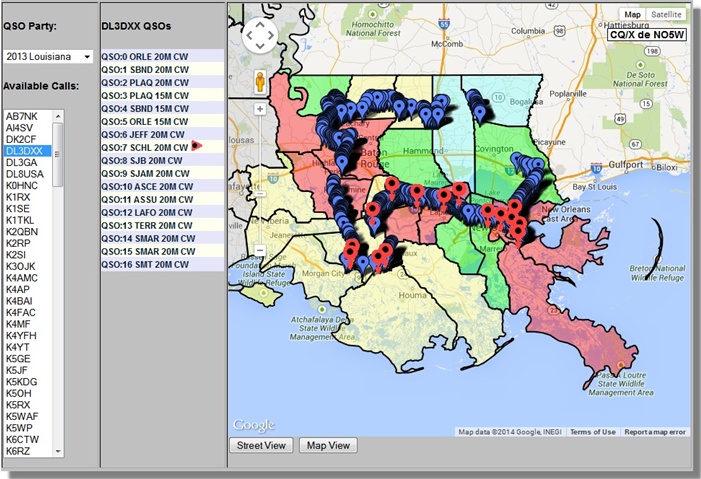 Copyright: C.W. Sanders, NO5W Last Updated: 26-April-2020 |